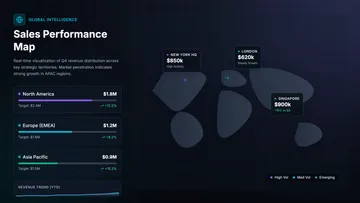
Visualize distribution across regions with this icon-color 16:9 map infographic. One vivid widescreen slide for decks—fully editable and AI-ready. Start free.
Start from “Distribution Map” and let AI tailor every slide to your content.
Use this template →